

American Airlines Poised for Upside as 7× Forward P/E Signals Undervaluation
By ATTN Desk · Editorial oversight: Sean Han
Bullish Case: American Airlines Poised for a Recovery Upside
American Airlines Group (NASDAQ: AAL) has traded down 9.1% over the past year, yet recent momentum and attractive valuation metrics argue for a cautiously bullish stance. While the 52-week range of $9.46–$18.38 underscores volatility, a moderate mid-term uptrend, strong recent momentum, and a forward P/E of 7.06 suggest the stock is pricing in undue pessimism.
Financial Health and Key Metrics
American Airlines has steadily emerged from pandemic losses into modest profitability. Below is a snapshot of its latest trailing-twelve-month (TTM) results as of its November 13, 2025 update:
| Metric | Value | Commentary |
|---|---|---|
| Stock Price (11/13/2025) | $13.46 | Near 52-week low; support around $9.00 |
| Market Cap | $8.6 billion | Small-mid-cap, high leverage |
| P/E (TTM) | 15.20× | Above forward, reflecting recent earnings |
| Forward P/E | 7.06× | Attractive vs. industry peers (~10–12×) |
| PEG Ratio (5-yr expected) | 0.41× | Implies undervaluation given growth forecast |
| Price/Sales (TTM) | 0.17× | Deep discount to broader market (~2×) |
| EV/Revenue | 0.70× | Cheap relative to global airline average (1×) |
| EV/EBITDA | 14.5× | In line with majors, despite higher debt |
| Revenue (TTM) | $54.3 billion | Roughly flat YoY; recovering to pre-COVID |
| Net Income (TTM) | $602 million | 1.1% margin, positive turnaround |
| Total Cash (MRQ) | $7.4 billion | Strong liquidity buffer |
| Levered Free Cash Flow (TTM) | $422 million | Positive but modest versus debt service needs |
| Implied Net Debt (EV – Market Cap) | ~$29.2 billion | Hefty but manageable given interest rates |
Revenue has nearly returned to 2019 levels, with profitability restored after pandemic losses. AAL generated $422 million of free cash flow over the past year, supporting interest payments on its substantial debt load. Its cash cushion of $7.4 billion provides flexibility for fleet investment and operational needs.
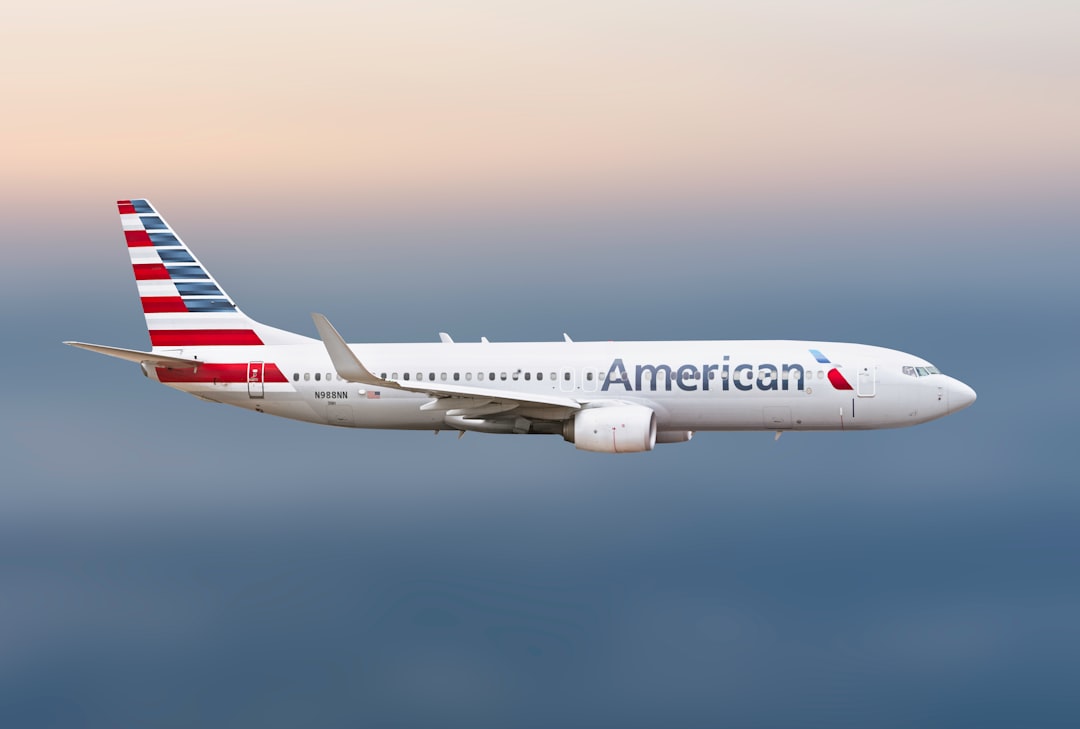
American Airlines by Ross Sokolovski
Competitive Position
As the world’s largest airline by capacity and scheduled revenue passenger miles, American Airlines maintains strong market share in key U.S. hubs—Dallas/Fort Worth, Chicago O’Hare, Charlotte, Miami, and others. Its competitive advantages include:
- Young Fleet: Post-pandemic fleet renewal yields fuel savings of 10–15% per seat-mile versus older models.
- Network Scale: Over 1,000 aircraft serving 50+ countries; large cargo operations diversify revenue.
- Loyalty Program: AAdvantage—one of the industry’s highest-value frequent-flyer programs—drives ancillary income.
- High Barriers to Entry: Slot restrictions at LaGuardia and Reagan National protect incumbents from new entrants.
Industry dynamics—rising pent-up travel demand, corporate travel rebounds, and consolidation—bode well for legacy carriers. While low-cost carriers exert pricing pressure on leisure routes, AAL’s network breadth and premium offerings help sustain yields.
Management and Corporate Governance
Under CEO Doug Parker’s leadership since the AMR–US Airways merger in 2013, American has:
- Navigated bankruptcy restructuring and emerged with renewed labor agreements.
- Executed a fleet modernization plan, lowering unit costs.
- Invested in digital platforms (mobile check-in, AI-powered customer service) to improve margins.
Corporate culture emphasizes operational reliability and customer care, as highlighted by recent LinkedIn updates thanking frontline teams for managing shutdown-related disruptions. Governance practices reflect industry norms: an independent board with aviation, finance, and regulatory expertise.
Risks and Opportunities
Risks
- Fuel Price Volatility: A 10% rise in jet fuel increases CASM by ~2–3%.
- Economic Downturn: Leisure demand may falter if consumer spending weakens.
- Regulatory Constraints: Slot divestitures (post-merger) cap growth at key airports.
- High Leverage: Net debt of ~$29 billion means interest coverage remains critical.
Opportunities
- Capacity Discipline: Industry-wide seat growth limited to ~3% annually may support yields.
- Ancillary Revenue Growth: Bag fees, premium seating, and co-branded credit cards can expand margins.
- International Expansion: New Latin American routes leverage AAL’s strong presence in the region.
- Sustainability Initiatives: Investment in sustainable aviation fuel may unlock regulatory credits and customer goodwill.
TL;DR
Despite a 9% 52-week drop and high leverage, American Airlines trades at just 7× forward earnings and 0.17× sales against industry norms of 10–12× and ~2×, respectively. Its young fleet, vast network, and restored profitability position it to capitalize on recovering travel demand. Key risks—fuel costs, economic cycles, and debt—are offset by strong liquidity and disciplined capacity. For value-oriented investors willing to weather airline cyclicality, AAL represents a compelling bull thesis.